


Welcome to Nature of Trading

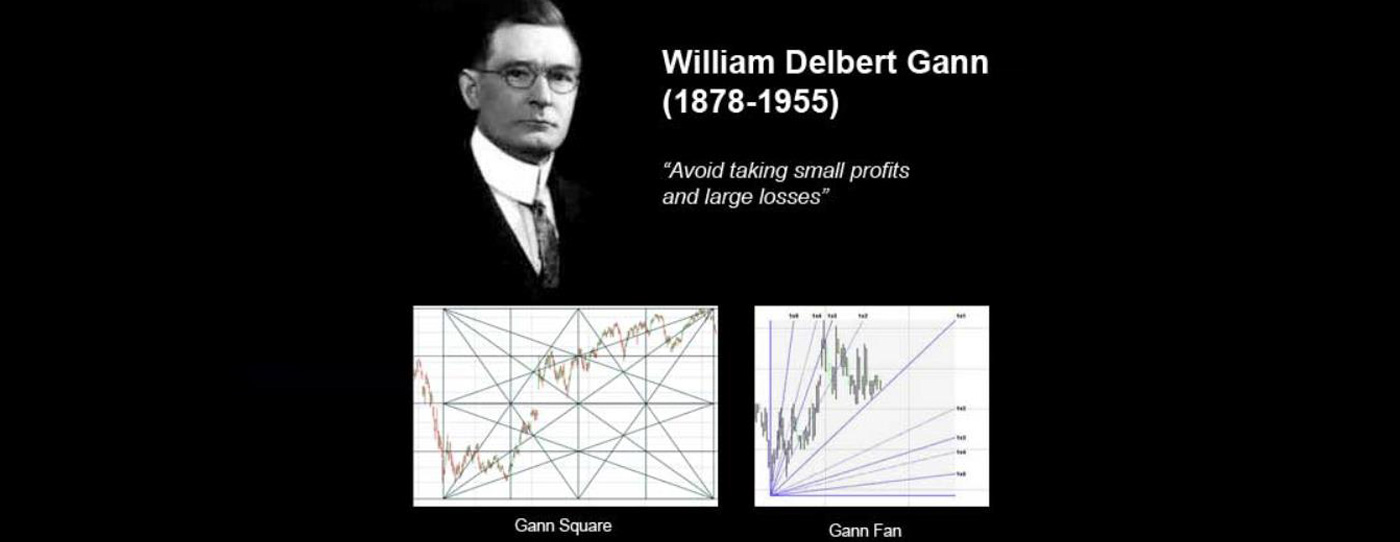
Who is W.D.Gann?
WD Gann is THE LEGEND in trading folklore. WD Gann's body of work was enormous and covered many interesting areas of speculative ventures including the stock market and commodities or futures trading.WD Gann was a legendary US trader who traded in 1910-1956. He invented more than 40 methods. He had left all the traders far beyond any comparison could be done.It is said that WD Gann traveled to Egypt and India and learning from these countries formed the basis of his core methodologies. He successfully predicted many turns in stock markets in advance. He was also known for his strict trading rules.
HAPPY NEWYEAR
COPPER UPDATE:JULY 14TH
LAST WEEK PRESSURE DATE ON 9TH AND 11TH JULY MADE MINOR BOTTOM. THIS WEEK COPPER BREAK ABOVE 902 RESISTANCE ARE -916.75-930-937.60-945-978.85-1068. IF COPPER BREAK BELOW 880 SUPPORT ARE-875.90 -871.90-858.50-851-831-826.45-795-789-775.10-762-756-752.50-738.90-730.45-724.10-722.40-707-699-694-675-669-663-656.50--649-640.60-630.70-626.65-620.60-617.45-613.50-600.60-593-586-578-573-561-557-553. THIS WEEK PRESSURE DATE JULY 16TH TRADE CAREFUL USING THIS LEVEL.
COPPER MAJOR RESISTANCE AND SUPPORT ARE 912.65 AND 869.10 WEEKLY CLOSING BASIS AND MONTHLY CLOSING BASIS ARE 916.60 AND 837.60
WEEKLY PLANETARY DATE'S JULY 14TH
FINANCIAL ASTROLOGY: ON MONDAY , MOON SQUARE VENUS. ON WEDNESDAY, MOON SQUARE JUPITER..ON THURSADY VENUS SEXTILE MERCURY. THIS WEEK KEY REVERSAL DAY OR TURNING POINT ARE LIKE TO BE ON MONDAY,WENESDAY AND THURSDAY .
GEOMETRIC TRANSLATION OF THE MAJOR PLANETARY ASPECTS:CONJUNCTION =0 DEGREES;SEXTILE =60 DEGREES;SQUARE =90 DEGREES;TRINE=120 DEGREES ;QUINCUNX OR IN CONJUNCT =150 DEGREES ;OPPOSITION =180 DEGREES.
COMMENTARY FOR GOLD TRADING THIS WEEK KEY PLANETARY RESISTANCE 3370 BREAK ABOVE THIS LEVEL NEXT RESISTANCE ARE -3375-3400-3438.09-3506-3600-3625.50. THIS WEEK KEY PLANETARY SUPPORT 3280 BREAK BELOW THIS LEVEL NEXT SUPPORT ARE -3244-3222-3104.70-066-3022.64-2974-2933-2916.80-2900-2863-2807-2735.80-2718-2708-2702-2674-2667-2632-2619-2608-2602-2554-2493-2458-2430-2420-2388-2349-2327-2306-2297-2280-2228-2174.75-2166.45--2149.70-2144-2101-2061.50-2052-2030.60-2022.88-2014.89-2005.16-2001-1992-1978-1971.71-1956.41-1945-1929-1911-1896-1857-1820-1790-1778-1753.
BEFORE you trade just ask 4 questions to yourself :
a) what is your entry level?
b) what is your stop loss level?
c) if market goes against you,can you afford this much loss?
d) is your profit target minimum 1:3?
If you know answer to all the four then only initiate a trade or else just remember
one famous rule by W D Gann:”WHEN IN DOUBT……..GET OUT”.
Daily Swing Chart
Why Trading
No Boss, No Employees Work
Your own Hours
Get Started With Low Capital
Limited Loss
Unlimited Rewards
Learn Without Risking A Penny
To Trade Profitably IT MUST be run like a Business
The effort you put in now, will be rewarded later
Take responsibility for your own actions
Plan your trade, trade your plan
Remove emotion
Remember, treat trading as a business
SOME IMPORTANT RULES OF W.D GANN
- If the high price of the entire week is achieved on Friday, expect higher prices next week.
- If the low price of the entire week is achieved on Friday, expect much lower price next week.
- In a highly up trending market weekly low's is achieved on Tuesday.
- If market is in strong down trend Gif main trend is down), the weekly highs are generally achieved on Wednesday.
- When the price crosses the high of the last four weeks, it's an advance indication of more higher prices.
- When the price breached the low of the last four weeks, it's an advance indication of more lower prices.
- In an up trending market if the prices breaks the 30 DMA remain below it at last for 2 consecutive days, it tells us of a much more great correction (vice versa).
- If the market rises for 5 consecutive days, there is a high probability that correction will be last for 3 days. (Ratio is 5:3).
- When the price starts rising from a particular level, Rs. 100 or 100% rise whichever is earlier becomes a strong resistance.
- When price crosses the high of the last 3 days it tells us about much more higher prices on the 4th day. (Traders can buy it on the 4th day and place a SL order Rs. 3 below the last 3 days high) (vice-versa).
- 50% of the last highest selling Price is the strong support area. Any stock which is trading below this 50% level is not the useful for investment
- If a price is rising for 9 consecutive days at a stretch, then there is highly probability for a correction for 5 consecutive days. (Ratio is 9:5)
- Don't ignore a double bottom & triple bottom signal on a monthly chart after a minimum gap of 6 months. (advance indication for midterm investment)
- Don't ignore a double top & triple top signal on a monthly chart, after minimum sap of 6 months. (Not the right place for investment /entry, price may fall)
- When price is in a choppy phase, or in a consolidation phase is sudden volume spike found there, it's an advance indication that trend likely to change.
- In a quarterly time frame when a particular stock crosses the high or low of the last quarter (in the quarterly chart) it's should be consider as an early indication that the underlying trend trying to reverse
Client Testimonials

Hello everyone, myself Krishna from mumbai. I am with Ganesh sir from last 29th Feb 2016 when nifty was made bottom of 6826. His unique master course of W.D Gann is very good. By doing this course u r able to earn a handsome profit from stock market everyday. His unique BOXER method for Nifty trading is too good for intraday as well as positional traders.” Sir teaching is simple and result oriented. If we follows the rules taught by him he/she will definitely will be profitable. After joining the course, I turned to be a professional trader. Here I found the way to do trading as a business. Really nice teaching. Mentor is dedicated to providing neat & clean understanding of market. i Enjoyed learning from him. taught me to discover high opportunity trades and guided me in continues improvement in trading. He encourages and motivates us. All the very best to you Ganesh sir Thank You.
I am Ramakrishnan from Hosur. I studied most of the technical classes but I'm not satisfied. Once I went to the Ganesh sir class I learned square of 9 & Gann frame, after learning this course I got more confident & become a professional trader. Thanks for Ganesh sir.
www.natureoftrading.com is an educational website for traders and investors. This update is an information service only .Recommendations, opinions or suggestions are given with the understanding that readers acting on this information assume all risks involved .The information provided herein is not to be construed as an offer to buy or sell securities of any kind .We do not assume any responsibility or liability resulting from the use of such information , judgments and opinions for Trading or investment purposes.